Tracking Executions
Every call to POST /v1/generate creates a pipeline execution. This guide covers how to track execution status, poll for results, and view your execution history.
Execution Lifecycle
Click a stage to see details
- Submit —
POST /v1/generatereturns anexecutionArnimmediately - Running — The pipeline processes your input (10–30 seconds typically)
- Complete — The execution reaches
SUCCEEDEDorFAILED
Polling for Results
Use GET /v1/status/{executionArn} to check execution status:
curl https://cloudsigma.a13e.com/v1/status/YOUR_EXECUTION_ARN \
  -H "Authorization: Bearer YOUR_API_KEY"
Recommended Polling Strategy
Poll every 2–3 seconds with exponential backoff:
import time
import requests

def wait_for_result(execution_arn, api_key, max_wait=120):
    url = f"https://cloudsigma.a13e.com/v1/status/{execution_arn}"
    headers = {"Authorization": f"Bearer {api_key}"}
    delay = 2

    elapsed = 0
    while elapsed < max_wait:
        resp = requests.get(url, headers=headers).json()
        status = resp["data"]["status"]

        if status == "SUCCEEDED":
            return resp["data"]["output"]
        if status == "FAILED":
            raise Exception(resp["data"].get("errorMessage", "Pipeline failed"))

        time.sleep(delay)
        elapsed += delay
        delay = min(delay * 1.5, 10)  # cap at 10 seconds

    raise TimeoutError("Pipeline did not complete in time")
Most pipelines complete in 10–30 seconds. The maximum execution time is 5 minutes. If an execution takes longer, it will be marked as FAILED with a timeout error.
Viewing Execution History
Use GET /v1/executions to list your recent executions:
curl "https://cloudsigma.a13e.com/v1/executions?limit=10" \
  -H "Authorization: Bearer YOUR_API_KEY"
This returns your most recent executions with summary information including input type, status, rules generated, and TTPs extracted.
History Limits
The execution history is tier-windowed — you can access your most recent 50 executions. There is no pagination; results are returned newest-first.
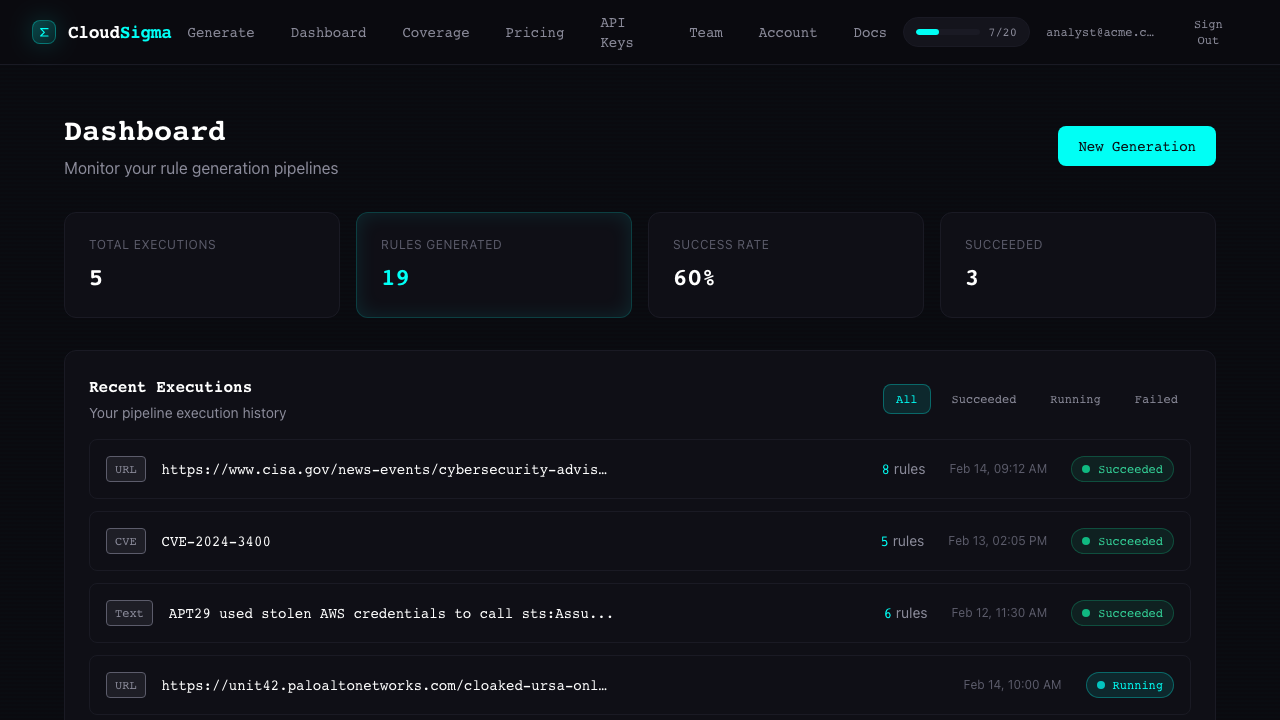
Web UI
You can also track executions in the CloudSigma web app:
- Status page — After submitting via the web UI, you are redirected to a live status page that polls automatically
- Dashboard — View all your recent executions with their status and results at cloudsigma.a13e.com/dashboard
Error Handling
When an execution fails, the status response includes an errorMessage:
{
  "status": "FAILED",
  "errorMessage": "TierLimitExceeded: Monthly rule generation limit reached"
}
Common failure reasons:
| Error | Cause | Resolution |
|---|---|---|
TierLimitExceeded | Monthly limit reached | Upgrade plan or wait for next period |
RateLimitExceeded | Too many requests/minute | Wait 60 seconds |
PipelineFailed | Internal error | Retry; contact support if persistent |
PipelineTimeout | Execution exceeded time limit | Try with simpler input |